Key takeaways
- The US Treasury bond market is currently "inverted” meaning that shorter-term bond actually has a higher yield than a longer-term bond
- Historically, the yield curve became inverted ahead of every recession over the last 40 years
- Really, the curve isn't "predicting" a recession; it is anticipating Fed rate cuts in the future
Something unusual is happening in the US Treasury bond market: it is "inverted." This is the term for a situation where a shorter-term bond actually has a higher yield than a longer-term bond, creating an inverted yield curve.
Historically, this has been an ominous sign. An inverted Treasury market has occurred ahead of every recession since 1980, which is why some people claim inversions predict recessions.
However, the reality is a bit more complicated.
What is the yield curve?
The yield on a bond is the amount of return you will receive if you hold the bond to maturity (until expiration).
For example, the 10-year Treasury bonds currently yield around 3.30%. So, if you bought this bond today and held it for the next ten years, you would wind up with a 3.3% annualized return on your investment.
The yield curve is a plot of individual bond yields by maturity. It makes it easy for an investor to consider how much more (or less) return could be garnered by owning a different bond.
Normally, the longer the bond term, the more yield investors earn by buying it. This is because longer-term bonds are usually considered riskier, all else equal. As a result, when general market interest rates rise, longer-term bonds tend to lose more money than shorter-term bonds.
We can see this phenomenon in this year's bond returns. For example, if you bought a 2-year Treasury bond at the start of 2022, you would have experienced a -3% return, whereas a buyer of a 10-year bond would have lost just over 13%.
Because of this risk of loss, investors typically demand more yield up-front for owning a longer-term bond.
In other words, investors usually need to be enticed to take on the extra maturity risk.
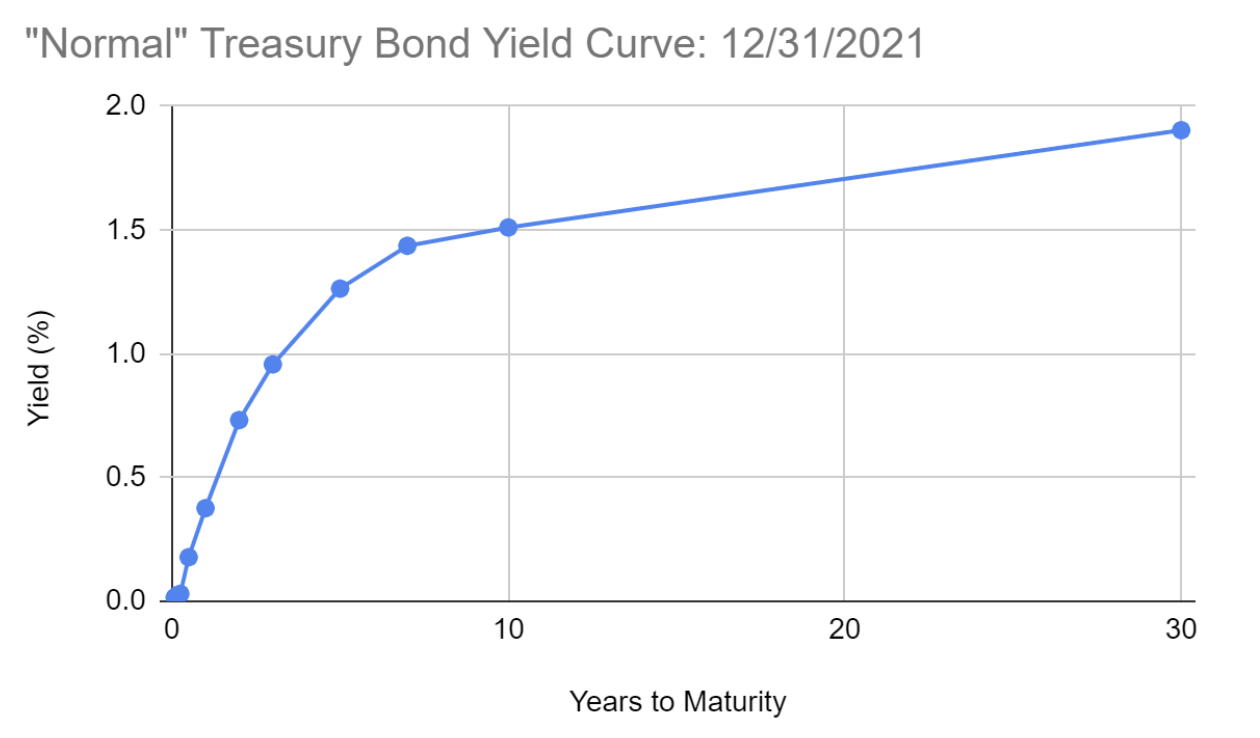
When you plot this on a yield curve, you would expect the curve to generally slope upward, meaning as you move longer in maturity, the yield rises. This is aptly called a "normal" curve.
Here is an example using the yield curve at the end of 2021.
At times though, the opposite happens. Investors actually accept less yield when buying longer-term bonds.
This is called an "inverted" curve because it is essentially upside down compared to the usual situation.
The most common maturities people cite when referring to an inverted curve is a 2-year Treasury vs. a 10-year Treasury.
Right now, the 2-year yields around 3.5% and the 10-year around 3.3%.
Here's the graph of today's yield curve.
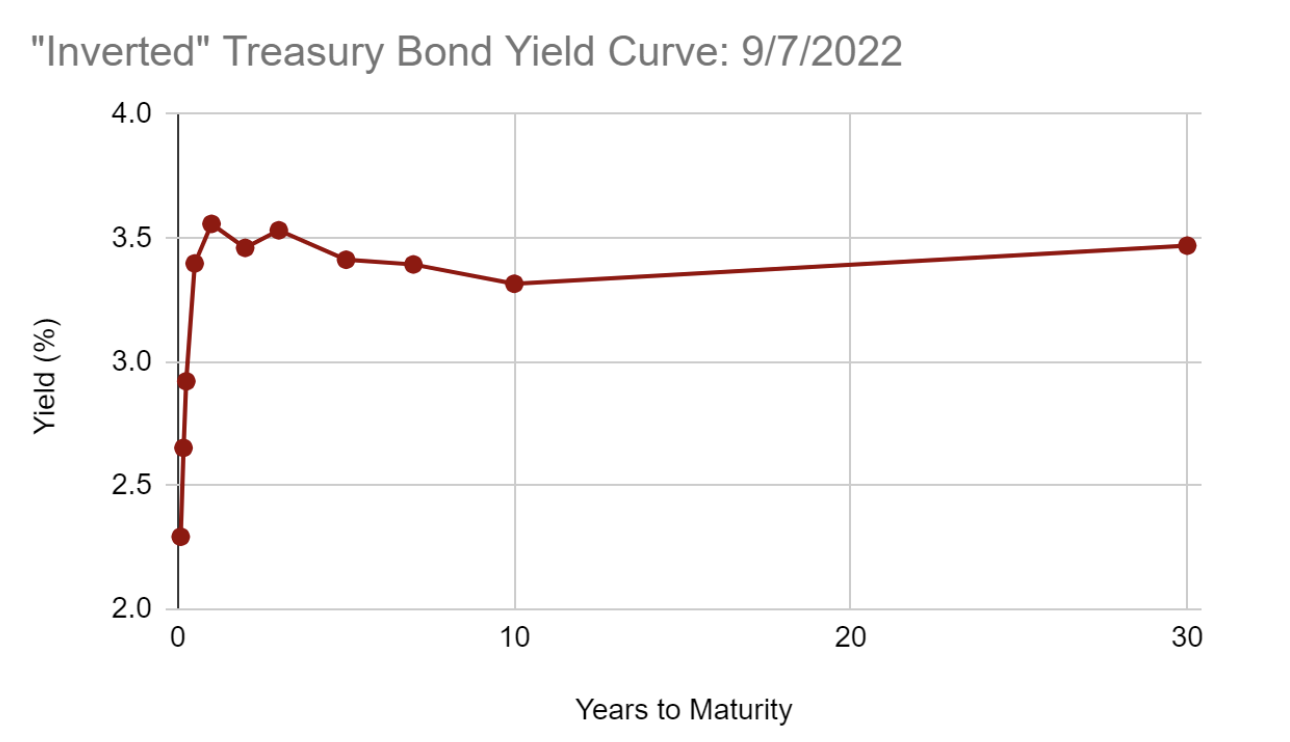
You can see that not every point on the curve is inverted, but because the 2-year is higher than the 10-year, we still call that "inverted."
Long-term rates vs. short-term rates
Earlier, we said that longer-term bonds are riskier than shorter-term bonds because, as interest rates rise, longer bonds tend to suffer larger price declines.
But guarding against rising rates isn't the only risk bond investors face. To see what we mean, consider that you had some defined amount of money you would spend in exactly two years.
Then, say that you are given two choices: you can buy the 2-year Treasury bonds right now, or buy a 1-month Treasury bill and reinvest that each month for the next two years.
If they both had exactly the same yield at 3.5%. Which would you choose?
Part of this decision comes down to whether you expect the 1-month bond yield to rise in the future.
If you do this, rates are going to rise, and if the starting yields are even, then this is seemingly a no-brainer: Buy the 1-month bond now, figuring you'll be able to reinvest at a higher rate later.
In this case, you might not want to buy the 2-year bond unless its yield was substantially higher to compensate for the likelihood of rates rising.
But what if you decide to go in the opposite direction? What if you think rates might fall?
In that case, you might be better off taking the 2-year rate today. In fact, if you were very confident future yields would be falling, you might be willing to accept a lower 2-year rate lock in that rate.
This example is a microcosm of how bonds get traded every day. Traders try to anticipate where future rates are going and trade the yields of different bond maturities until they have reached a fair value vs. future expectations.
Essentially, all this means is that every bond yield reflects the market's expectations for the future.
Because bonds have different maturities, these future expectations also encompass different time periods: a 2-year rate is set by expectations for the next two years, while the 10-year rate is set by expectations over the next ten years.
How does the Fed figure into this?
When we say traders anticipate future rates, we're talking about the Federal Reserve's policy rate. In the U.S., the Fed essentially controls very short-term interest rates (i.e., anything a month or less).
So in real life, when bond traders conduct a version of the exercise we described above, they compare their future expectations of the Fed rate vs. the current rate on other bond maturities.
This is basically how all interest rates are set in the Treasury market.
Traders would buy the 10-year Treasury if they thought the current yield would be higher than the average Fed rate over the next 10 years.
This buying pushes the yield down because higher prices equate to lower yields. This keeps happening until traders experience indifference (e.g., the 10-year yield is exactly the same as future Fed expectations).
Of course, other factors influence Treasury yields, but this future Fed policy factor is the most dominant by far.
From this, we can see how it might be that the 2-year Treasury yield winds up higher than the 10-year yield.
It is simply that markets anticipate the Fed will hold interest rates higher over the next 2-years---but over a longer period---rates won't actually remain that high.
In other words, an inverted curve is a sign that markets think Fed rate hikes are near an end and the Fed will be cutting rates at some point in the future.
Does an inverted yield curve predict a recession?
We started this discussion by saying that the yield curve became inverted ahead of every recession over the last 40 years. But really, the curve isn't "predicting" a recession; it is anticipating Fed rate cuts.
The reason this event has coincided with recessions is that the Fed tends to cut rates during recessions.
This is an important distinction, though. The Fed could wind up cutting rates for other reasons, and the curve would still invert.
An excellent example of this was the curve inversion in August of 2019. At the time, the Fed had already cut rates once, and Fed Chair Jerome Powell was telegraphing to markets that perhaps a couple more cuts were coming.
The curve quickly inverted---with traders assuming that the Fed would cut two more times---and rates would remain steady.
Of course, we now know a recession was looming in March 2020. However, that had nothing to do with typical economics and everything to do with a pandemic.
Odds are that had COVID not hit, a recession wouldn't have occurred following the 2019 curve inversion.
How can the market anticipate rate cuts with inflation so high?
It may seem odd that markets are anticipating the Fed could be cutting rates soon, given that inflation is currently so high, but if we listen to the Fed's own words, it makes perfect sense.
In Chair Powell's Jackson Hole address in August, he said that he wanted to hike rates "to a level that will be sufficiently restrictive to return inflation to 2 percent."
In Fed jargon, "restrictive" means hiking rates to a level that makes borrowing so expensive that both companies and households do less of it. That results in less home buying, fewer construction projects, etc., and is the key way the Fed uses rates to fight inflation.
Logically the Fed doesn't intend to keep interest rates "restrictive" forever. In other words, circumstances won't always be such that the Fed needs to restrict the economy.
At some point inflation will normalize and, presumably, the Fed will want interest rates to be more neutral and non-restrictive.
This is what the yield curve tells us today with the 2-year and 10-year inversion. The 2-year rate is high because the Fed is currently hiking and will probably continue for the rest of 2022.
However, at some point after that, inflation should subside, and the Fed won't want rates to be quite so high anymore. Therefore, the average Fed rate will probably be higher over the next two years than in the next 10 years.
Note that we aren't saying there won't be a recession. Instead, we are saying that the yield curve isn't "predicting" a recession but rather foretelling the end of its hiking cycle.
What does this mean for you?
So what does this mean for your investment portfolio?
We already mentioned that it doesn't automatically mean there will be a recession. And it certainly doesn't tell us anything about how severe a recession might be if there were one.
Thus, it isn't a signal for how equity markets will perform. For example, of the five most recent curve inversions before this one, the S&P 500 averaged a 9.7% return in the 12 months after the initial inversion.
Second, be careful making any decisions related to interest rates merely on the fact that the yield curve is inverted.
For bond investors, buying a shorter bond with a higher yield is sometimes tempting. However, the problem is that the only reason that bond has a higher yield is that everyone is anticipating lower future yields.
So when that bond matures, you might wish you had locked in longer rates. We prefer sticking with a broad bond allocation.
We would point out that the reasons why the yield curve is inverted now are related to why we are optimistic about fixed income returns.
If inflation becomes a more persistent problem, short-term interest rates will likely keep rising. However, the market will still anticipate the Fed eventually backing off "restrictive" policy. This limits the potential for longer-term yields to rise.
Indeed, during the 1970's inflationary period, the yield curve became severely inverted for this very reason. Of course, we don't think today's inflation will be as lasting as the 1970's period, but it does suggest how the curve might act in a more severe scenario.
On the other hand, if inflation falls rapidly, perhaps because the economy sinks into a recession, we expect all interest rates to fall, which would boost returns for bond funds.
The yield curve inverting is an interesting phenomenon that tells us what markets anticipate. But unfortunately, at times the media can speak of an inversion as though it has the divining power to predict recessions, which just isn't the case.
As Facet we think about optimizing our client portfolios for risk and reward, the fact that the curve is inverted is a notable data point, but it is only one of many we consider.